
Note: This publish-ready article is written in standard American English, synthesized from reputable educational probability and statistics references, and formatted as body-only HTML for easy copying.
Introduction: Why Expected Value Is the Math Version of “Let’s Be Real”
Expected value sounds like something a robot would say before predicting whether your toast will land butter-side down. But in probability and statistics, it is one of the most practical ideas you can learn. Expected value helps you estimate the average result you would get if the same uncertain situation happened many times. It does not promise what will happen next. Instead, it tells you what the long-run average should look like.
That difference matters. If you roll a fair six-sided die once, you will never roll a 3.5. Dice are rude that way. But the expected value of one fair die roll is 3.5 because, over thousands of rolls, the average result gets closer and closer to 3.5. Expected value is not a fortune-teller. It is more like a calm accountant standing behind the chaos with a clipboard.
In this guide, we will break down 3 ways to calculate an expected value: using a probability distribution table, using a formula for a discrete random variable, and using expected value in real-world decision-making. Along the way, you will see simple examples, common mistakes, and practical tips that make the concept easier to remember.
What Is Expected Value?
Expected value, often written as EV, E(X), or the Greek letter μ, is the weighted average of all possible outcomes of a random variable. Each outcome is multiplied by its probability, and then all those products are added together.
In plain English, expected value answers this question: If this situation repeated many times, what average outcome should I expect?
The basic expected value formula for a discrete random variable is:
Where:
- x is a possible outcome.
- P(x) is the probability of that outcome.
- Σ means “add everything up.”
Expected value is used in statistics, finance, insurance, sports analytics, data science, game design, quality control, and everyday decision-making. Even if you never become a statistician, understanding expected value can help you think more clearly when outcomes are uncertain.
Way 1: Calculate Expected Value with a Probability Distribution Table
The easiest way to calculate expected value is by making a probability distribution table. This method is especially helpful when you can list every possible outcome and its probability.
Step 1: List All Possible Outcomes
Suppose you roll a fair six-sided die. The possible outcomes are:
Each number has the same probability because the die is fair. The probability of each outcome is:
Step 2: Multiply Each Outcome by Its Probability
Now multiply each die result by the probability of rolling it:
| Outcome | Probability | Outcome × Probability |
|---|---|---|
| 1 | 1/6 | 1/6 |
| 2 | 1/6 | 2/6 |
| 3 | 1/6 | 3/6 |
| 4 | 1/6 | 4/6 |
| 5 | 1/6 | 5/6 |
| 6 | 1/6 | 6/6 |
Step 3: Add the Products
Add the final column:
The expected value of rolling one fair die is 3.5. Again, you cannot roll a 3.5, unless your die has been through a very strange accident. But over many rolls, the average result should approach 3.5.
Why This Method Works
A probability distribution table keeps everything organized. It helps you avoid skipping an outcome or mixing up probabilities. This method is excellent for school problems, simple games, surveys, product defect rates, and any situation where outcomes are countable and easy to list.
Way 2: Calculate Expected Value with the Discrete Random Variable Formula
The second way to calculate expected value is to use the formal formula for a discrete random variable. A discrete random variable has separate, countable outcomes, such as the number of heads in coin flips, the number of customers arriving in an hour, or the number of correct answers on a quiz.
The formula is:
This is just the table method written in mathematical shorthand. It may look fancy, but it is still the same “multiply and add” process.
Example: Expected Value of a Simple Quiz Guess
Imagine a one-question multiple-choice quiz with four answer choices. Only one answer is correct. You guess randomly. If you get the answer right, you earn 10 points. If you get it wrong, you earn 0 points.
The possible outcomes are:
- 10 points with probability 1/4
- 0 points with probability 3/4
Now calculate the expected value:
Your expected score from guessing is 2.5 points. That does not mean your teacher will give you 2.5 points for “vibes.” It means that if you guessed on many similar questions, your average score would be about 2.5 points per question.
Example: Expected Value of a Two-Coin Flip
Suppose you flip two fair coins and let X be the number of heads. The possible outcomes for X are 0, 1, and 2.
| Number of Heads | Probability | Product |
|---|---|---|
| 0 | 1/4 | 0 |
| 1 | 2/4 | 1/2 |
| 2 | 1/4 | 1/2 |
Now add the products:
The expected number of heads in two fair coin flips is 1. This makes intuitive sense: two flips, each with a 50% chance of heads, should average one head over the long run.
Way 3: Calculate Expected Value for Real-World Decisions
The third way to calculate expected value is to apply it to choices. This is where expected value becomes especially useful. Instead of only solving textbook problems, you can use EV to compare possible decisions when each option has uncertain outcomes.
This method is common in business, economics, insurance, investing, project planning, marketing, sports strategy, and risk analysis. The idea is simple: estimate the possible results, assign probabilities, multiply each result by its probability, and compare the expected values.
Example: A Small Business Promotion
Imagine a small online store is considering a $200 advertising campaign. The owner estimates three possible outcomes:
| Outcome | Net Profit or Loss | Probability |
|---|---|---|
| Campaign performs well | $800 | 20% |
| Campaign performs moderately | $200 | 50% |
| Campaign performs poorly | -$200 | 30% |
Now calculate the expected value:
The expected value of the campaign is $200. This means that, based on the estimates, the campaign has a positive average expected return. It does not guarantee success, but it gives the owner a more rational basis for deciding.
Example: Product Quality Control
Suppose a company makes a product that earns $50 profit when it works correctly but causes a $150 loss when it is defective and must be replaced. If 95% of products work correctly and 5% are defective, the expected value per product is:
The expected profit is $40 per product. This calculation can help a company understand whether improving quality control is worth the cost. If a new inspection process reduces defects and increases expected profit, it may be a smart investment.
Why Real-World Expected Value Requires Judgment
In real life, the hardest part is not the arithmetic. The hardest part is estimating probabilities honestly. A formula can be perfect while the assumptions are wobbly. If your probability estimates are based on wishful thinking, expected value becomes a very polished way to fool yourself.
That is why real-world EV calculations should use historical data, reliable samples, expert input, or conservative estimates whenever possible. Expected value works best when your probabilities are grounded in reality, not optimism wearing a fake mustache.
Expected Value for Continuous Random Variables
So far, we have focused on discrete outcomes. But some random variables are continuous, meaning they can take infinitely many values within a range. Examples include height, time, temperature, distance, and product lifespan.
For a continuous random variable, expected value is calculated with an integral:
Here, f(x) is the probability density function. Instead of adding separate products, you integrate across a range of possible values. The concept is still similar: expected value is the balance point or long-run average of the distribution.
If you are learning basic probability, you may not need continuous expected value right away. But it is useful to know that the same idea extends beyond coin flips, dice rolls, and probability tables.
Common Mistakes When Calculating Expected Value
1. Forgetting That Probabilities Must Add Up to 1
Before calculating expected value, check that your probabilities total 1, or 100%. If they do not, something is missing or counted twice. Expected value depends on a complete probability model.
2. Using Gross Gain Instead of Net Gain
In financial examples, be careful with costs. If you spend $10 for a chance to win $50, your net gain is not $50. It is $40, because you paid $10 to participate. Many expected value mistakes happen because people forget to subtract the cost.
3. Thinking Expected Value Predicts One Event
Expected value is a long-run average, not a single-event prediction. A positive expected value does not mean every attempt will be profitable. A negative expected value does not mean every attempt will fail. It describes the average result over repeated trials.
4. Ignoring Risk and Variability
Two choices can have the same expected value but very different levels of risk. One option might offer a steady $50. Another might offer a 50% chance of $100 and a 50% chance of $0. Both have an expected value of $50, but they feel very different in real life.
How to Interpret Expected Value Correctly
The best way to understand expected value is to think in repetitions. If the same random process happened hundreds, thousands, or millions of times, expected value tells you the average outcome you would expect.
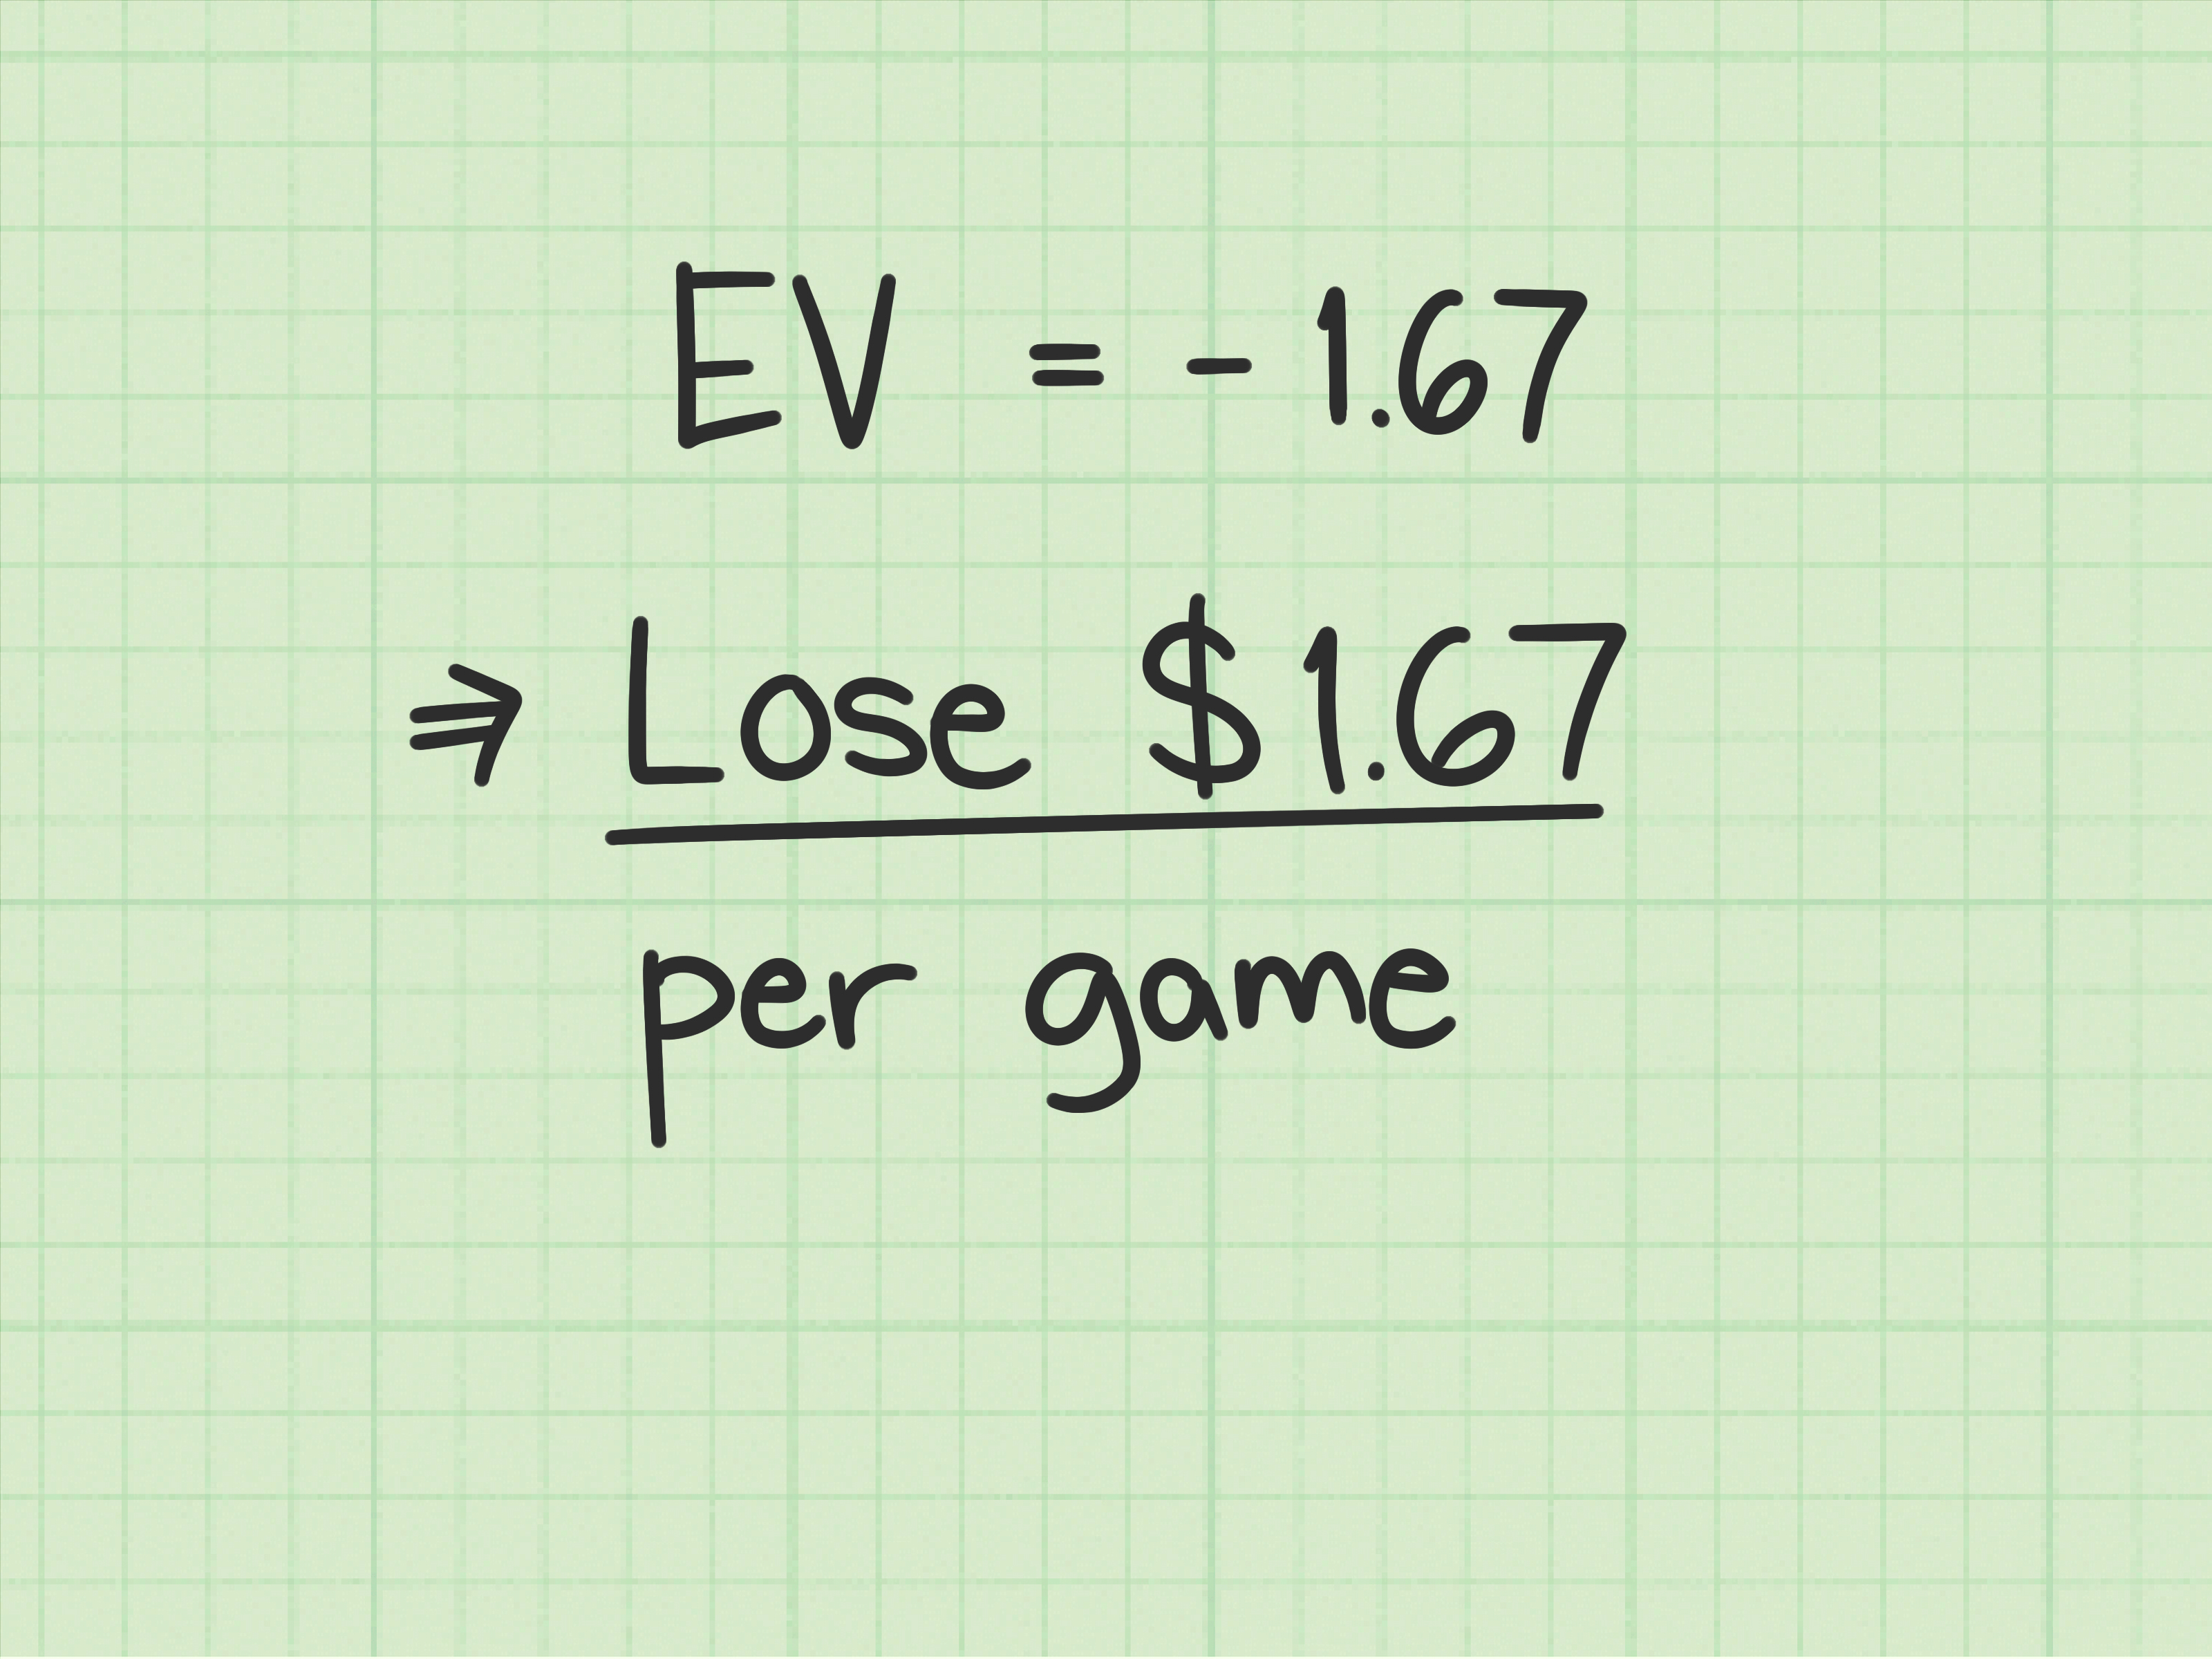
For example, if a game has an expected value of -$2 per play, it means you would lose about $2 per play on average over the long run. You might win once. You might win twice. You might even brag loudly after winning. But if the probabilities stay the same and you keep playing, the average result should move toward the expected value.
Expected value also helps separate emotional reactions from mathematical reasoning. Humans are naturally drawn to dramatic outcomes. We notice the big win, the lucky break, or the rare disaster. Expected value asks us to slow down and consider every outcome, including the boring ones that quietly dominate the average.
Quick Practice Problems
Practice Problem 1
A bag contains three red marbles and one blue marble. You earn $4 if you draw a red marble and lose $2 if you draw a blue marble. What is the expected value?
The expected value is $2.50.
Practice Problem 2
A random variable X has the following distribution:
| X | Probability |
|---|---|
| 2 | 0.20 |
| 5 | 0.50 |
| 9 | 0.30 |
The expected value is 5.6.
500-Word Experience Section: What Learning Expected Value Feels Like in Real Life
Learning expected value can feel a little awkward at first because it asks your brain to stop chasing the outcome that feels most exciting. Most people naturally focus on what could happen: the biggest reward, the worst loss, or the result they hope for. Expected value says, “That is nice, but let’s invite probability to the meeting.”
One of the most useful experiences with expected value is realizing how often people confuse possibility with probability. A possible outcome can be dramatic, but that does not make it likely. For example, a student may look at a difficult multiple-choice test and think, “Technically, I could guess every answer correctly.” True. Also technically, a raccoon could become a mayor if enough people made questionable decisions. Expected value helps bring the conversation back to what is likely on average.
Another practical experience comes from comparing choices. Imagine you are choosing between two school fundraising ideas. One idea has a small but steady return. The other could earn a lot, but only if many people participate. Expected value helps you estimate both options more fairly. You list the possible results, assign probabilities, and calculate the average expected outcome. Suddenly, the flashy option may not look as magical, or the boring option may reveal itself as secretly brilliant.
Expected value also teaches patience. In short runs, randomness can be messy. A good decision can still lead to a bad outcome once. A bad decision can get lucky once. This is why expected value is so important in fields like business, insurance, and analytics. Professionals are not trying to be right every single time. They are trying to make decisions that are favorable over many repeated situations.
For students, the biggest breakthrough usually happens when expected value stops being a formula and starts becoming a habit of thinking. Instead of asking, “What do I want to happen?” you begin asking, “What are the possible outcomes, how likely are they, and what is the average result?” That shift is powerful. It makes your reasoning more careful and less emotional.
A good tip from experience is to always write the outcomes first. Do not rush into the formula. Make a table. Label each outcome. Add the probabilities. Check that they total 1. Then multiply and add. This simple routine prevents most mistakes. It also makes your work easier to explain, which is helpful when a teacher, client, teammate, or confused friend asks, “Wait, how did you get that?”
Expected value is not just a statistics topic. It is a thinking tool. It helps you understand averages, risk, rewards, and uncertainty. Whether you are solving homework, evaluating a project, reading data, or making everyday decisions, expected value gives you a clearer way to deal with the unknown. And honestly, any math idea that makes uncertainty less annoying deserves a small round of applause.
Conclusion: Expected Value Makes Uncertainty Easier to Measure
Expected value is one of the most useful concepts in probability because it turns uncertain outcomes into a single long-run average. To calculate it, you multiply each possible outcome by its probability and add the products. You can do this with a probability distribution table, a discrete random variable formula, or a real-world decision model.
The key is interpretation. Expected value does not guarantee the next result. It tells you what should happen on average if the same situation repeats many times. Once you understand that, expected value becomes more than a formula. It becomes a practical tool for clearer thinking, better comparisons, and smarter decisions under uncertainty.