
Finding equilibrium quantity may sound like something economists do while wearing tweed jackets and arguing with graphs, but the idea is surprisingly practical. It answers a simple question: How many units of a product will actually be bought and sold when buyers and sellers agree on a market price?
Whether you are studying microeconomics, pricing handmade candles, analyzing coffee sales, or trying to understand why concert tickets vanish faster than snacks at a staff meeting, equilibrium quantity helps explain how markets settle into balance. It is the point where quantity demanded equals quantity supplied. In plain English, buyers want to buy exactly the amount sellers want to sell at a specific price.
This guide explains how to find equilibrium quantity using formulas, graphs, tables, and real-world examples. We will keep the math clear, the examples specific, and the jargon on a short leash.
What Is Equilibrium Quantity?
Equilibrium quantity is the amount of a good or service bought and sold when the market is in equilibrium. At this point, demand and supply are balanced. There is no major shortage pushing prices upward and no big surplus pushing prices downward.
In a supply and demand graph, equilibrium quantity appears at the point where the demand curve and supply curve intersect. The matching price is called the equilibrium price. Together, equilibrium price and equilibrium quantity show the market-clearing point.
Simple Definition
Equilibrium quantity is the quantity exchanged in a market when:
- Quantity demanded equals quantity supplied
- Buyers are willing to purchase the same number of units sellers are willing to provide
- The market has no shortage or surplus at that price
Think of it like a perfectly balanced seesaw. Demand sits on one side, supply sits on the other, and equilibrium is the moment nobody goes flying into the mulch.
Why Equilibrium Quantity Matters
Equilibrium quantity matters because it helps explain how markets decide “how much” gets sold. Businesses use this concept to estimate sales volume, students use it to solve economics problems, and analysts use it to understand market changes.
For example, if a bakery sells cupcakes, the owner may want to know how many cupcakes customers will buy at different prices. If the price is too high, customers buy fewer cupcakes. If the price is too low, the bakery may not want to produce as many because profit shrinks. The equilibrium quantity shows the output level where customer demand and bakery supply meet.
This concept also helps explain shortages and surpluses. If the market price is below equilibrium, buyers want more than sellers provide, creating a shortage. If the price is above equilibrium, sellers provide more than buyers want, creating a surplus. Either way, the market gets cranky until price adjusts.
The Basic Equilibrium Quantity Formula
The most important rule is simple:
Equilibrium occurs when quantity demanded equals quantity supplied.
In formula form:
Qd = Qs
Where:
- Qd = quantity demanded
- Qs = quantity supplied
To find equilibrium quantity, you usually solve for the equilibrium price first. Then you plug that price into either the demand equation or the supply equation. Both should give the same quantity if your math behaves itself.
Common Demand and Supply Equations
In many classroom problems, demand and supply are written as linear equations. They often look like this:
Demand equation: Qd = a – bP
Supply equation: Qs = c + dP
Where:
- P = price
- a = maximum demand when price is zero
- b = how much demand changes when price changes
- c = starting quantity supplied
- d = how much supply changes when price changes
Demand usually slopes downward because higher prices tend to reduce quantity demanded. Supply usually slopes upward because higher prices encourage sellers to produce more. These two forces meet at equilibrium, where the market says, “Fine, this works.”
How to Find Equilibrium Quantity Step by Step
Here is the easiest method for finding equilibrium quantity when you are given demand and supply equations.
Step 1: Write Down the Demand and Supply Equations
Start by identifying Qd and Qs. For example:
Qd = 100 – 5P
Qs = 20 + 3P
This means consumers buy fewer units as price rises, while producers supply more units as price rises.
Step 2: Set Quantity Demanded Equal to Quantity Supplied
Because equilibrium happens when Qd = Qs, set the two equations equal:
100 – 5P = 20 + 3P
Step 3: Solve for Price
Now solve the equation:
100 – 5P = 20 + 3P
100 – 20 = 3P + 5P
80 = 8P
P = 10
The equilibrium price is $10.
Step 4: Plug the Price Into Either Equation
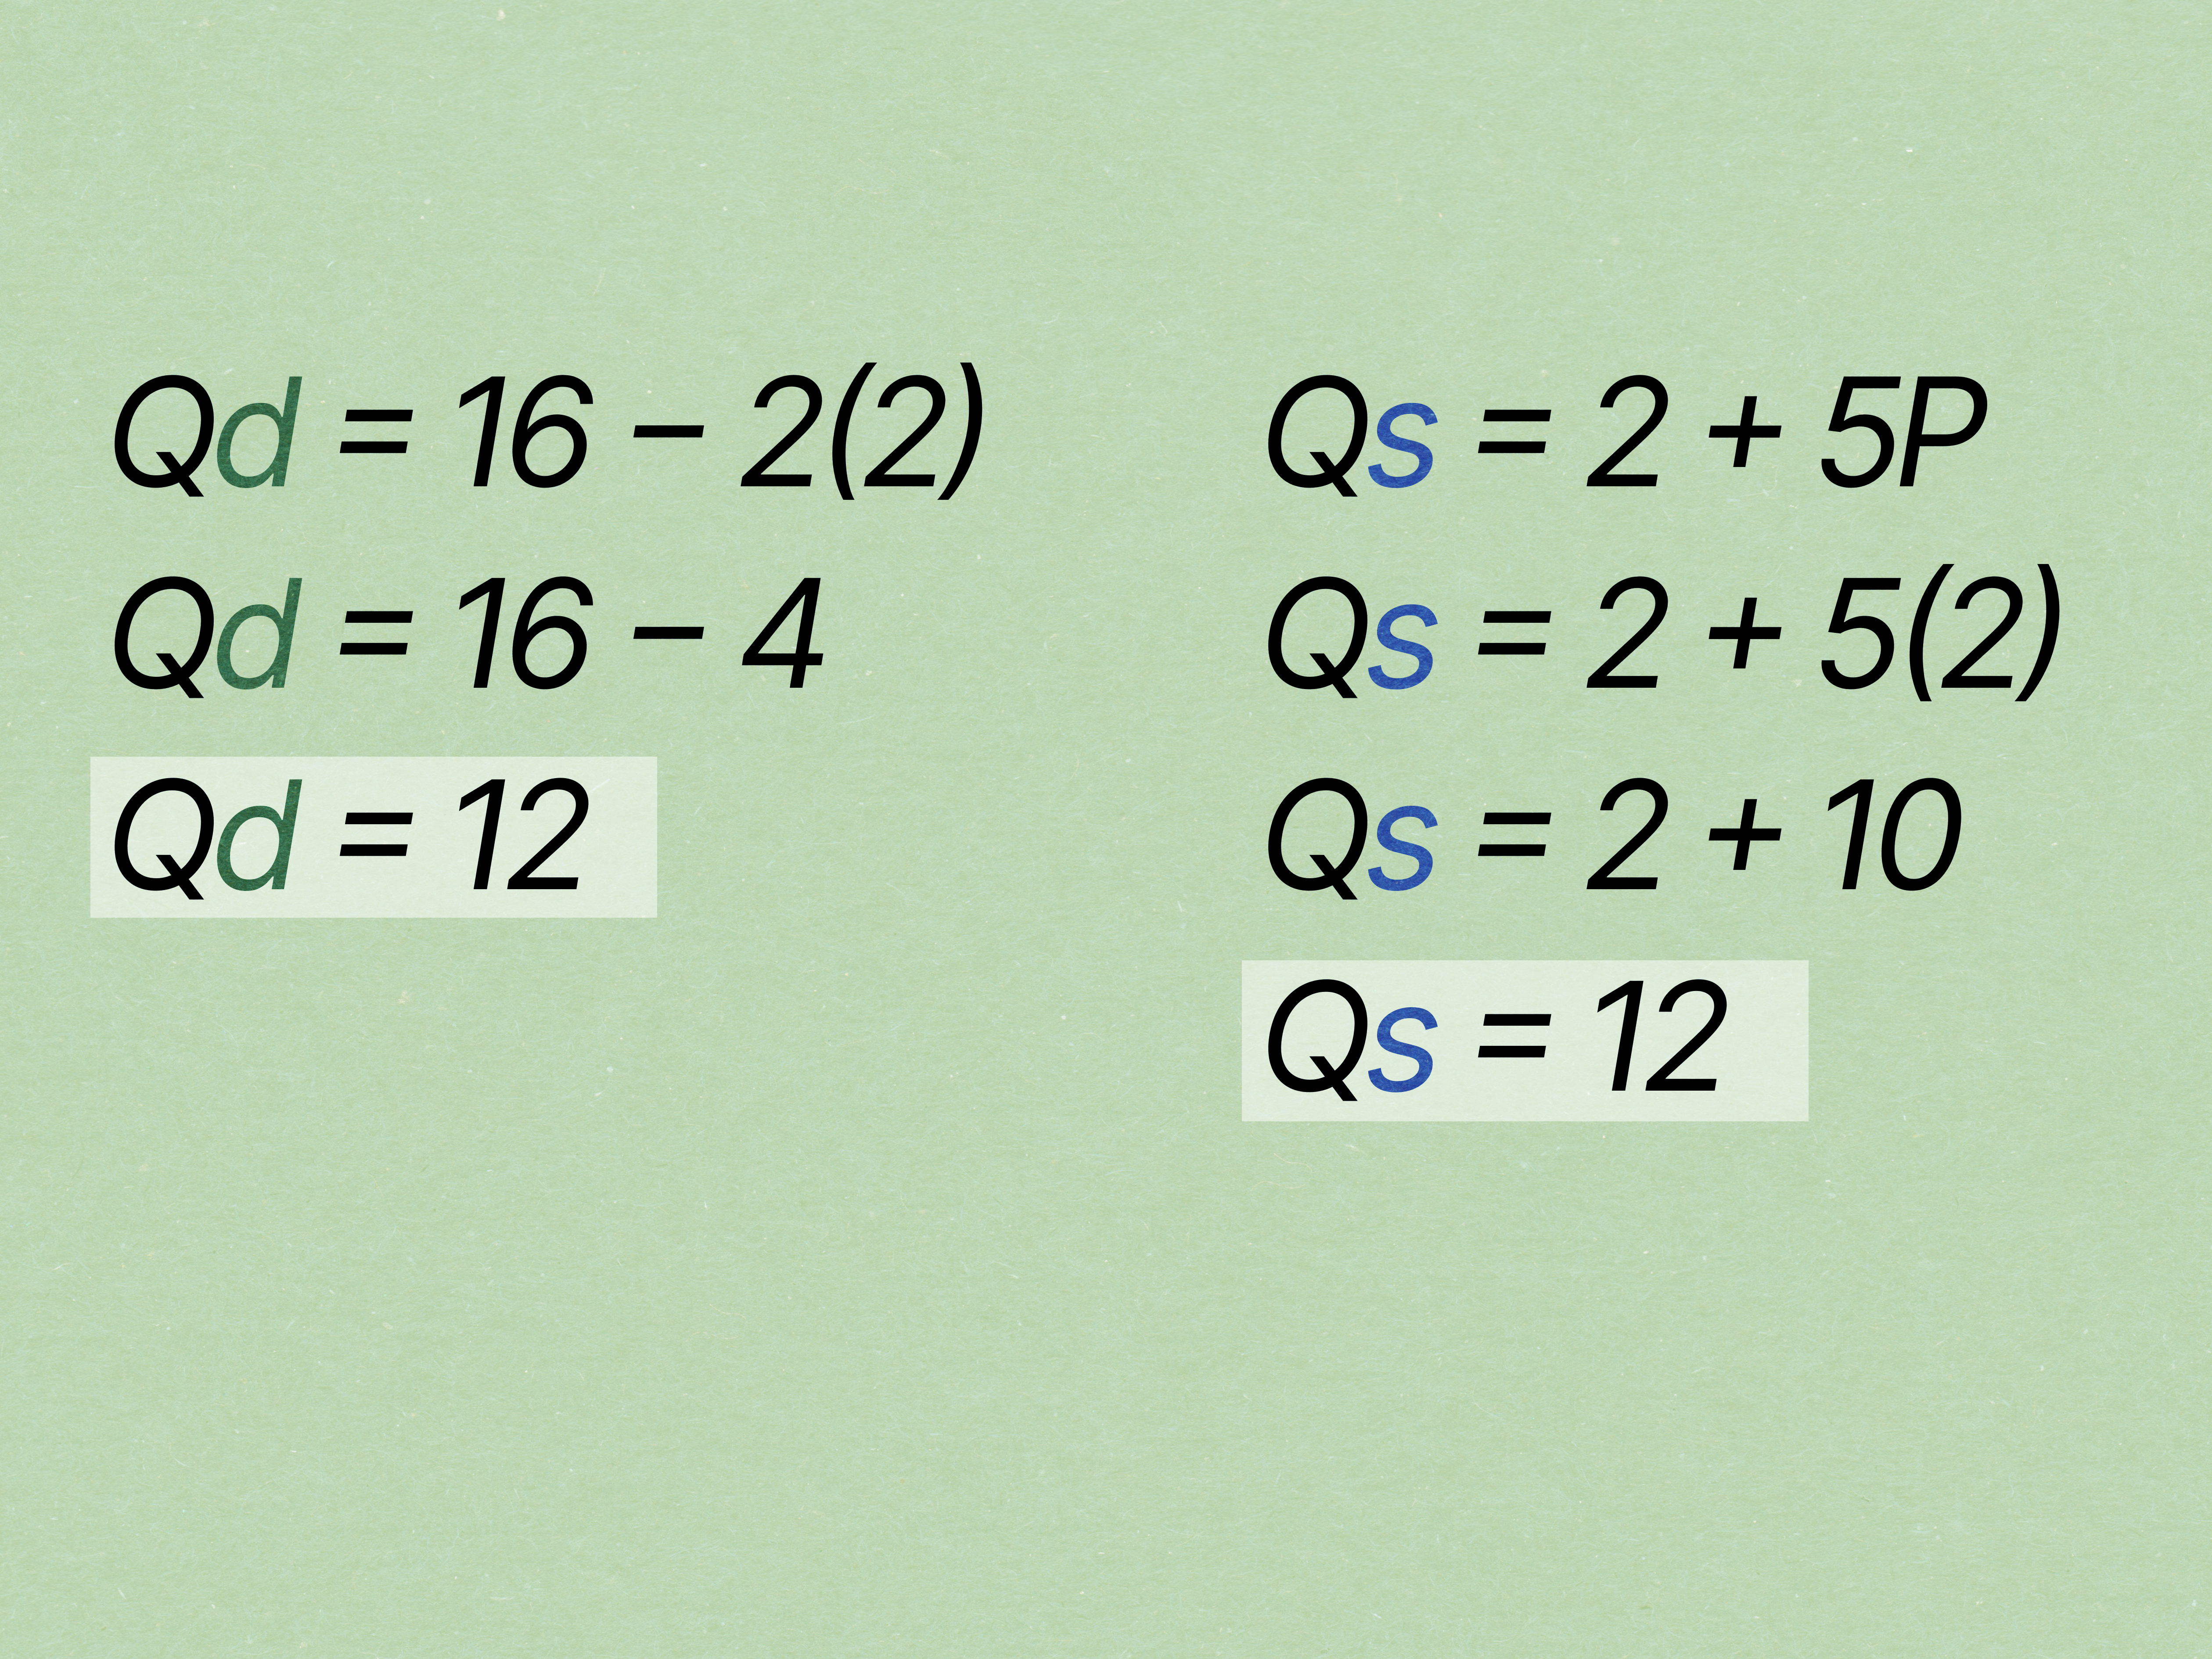
Now substitute P = 10 into the demand equation:
Qd = 100 – 5(10)
Qd = 100 – 50
Qd = 50
Check with the supply equation:
Qs = 20 + 3(10)
Qs = 20 + 30
Qs = 50
Both equations give 50, so the equilibrium quantity is 50 units.
Example 1: Finding Equilibrium Quantity for Coffee
Let’s say a local coffee market has the following equations:
Qd = 240 – 20P
Qs = 40 + 30P
Set demand equal to supply:
240 – 20P = 40 + 30P
Solve for P:
240 – 40 = 30P + 20P
200 = 50P
P = 4
Now plug P = 4 into either equation:
Qd = 240 – 20(4)
Qd = 240 – 80
Qd = 160
Or:
Qs = 40 + 30(4)
Qs = 40 + 120
Qs = 160
The equilibrium price is $4, and the equilibrium quantity is 160 cups of coffee. That is also known as a very productive morning.
Example 2: Finding Equilibrium Quantity With a Table
Sometimes, instead of equations, you receive a demand and supply schedule. A schedule is just a table that shows quantity demanded and quantity supplied at different prices.
| Price | Quantity Demanded | Quantity Supplied |
|---|---|---|
| $2 | 90 | 30 |
| $4 | 75 | 50 |
| $6 | 60 | 60 |
| $8 | 45 | 75 |
| $10 | 30 | 90 |
Look for the row where quantity demanded equals quantity supplied. At $6, both quantities are 60. Therefore:
Equilibrium price = $6
Equilibrium quantity = 60 units
This method is quick because there is no algebra. You simply find the match. It is like dating apps for numbers, except less emotionally exhausting.
Example 3: Finding Equilibrium Quantity From a Graph
When demand and supply are shown on a graph, the equilibrium quantity is found at the intersection of the two curves. The vertical axis usually shows price, and the horizontal axis usually shows quantity.
To find equilibrium quantity on a graph:
- Find the point where the demand curve and supply curve cross.
- Move straight down from that point to the quantity axis.
- The number on the quantity axis is the equilibrium quantity.
If the curves intersect at a price of $12 and a quantity of 300, the equilibrium quantity is 300 units. The equilibrium price is $12.
The graph method is useful because it helps you see the market visually. You can quickly spot whether a price creates a shortage, surplus, or balance.
What Happens Above and Below Equilibrium?
Equilibrium quantity only makes full sense when you also understand what happens away from equilibrium.
When Price Is Above Equilibrium
If the price is higher than the equilibrium price, quantity supplied is greater than quantity demanded. Sellers want to sell more than buyers want to buy. This creates a surplus.
For example, if a store charges $20 for a water bottle that customers think is worth $8, shelves may stay full. The store may lower the price to attract buyers. As price falls, quantity demanded rises and quantity supplied falls until the market moves back toward equilibrium.
When Price Is Below Equilibrium
If the price is lower than the equilibrium price, quantity demanded is greater than quantity supplied. Buyers want more than sellers are willing to offer. This creates a shortage.
Imagine a pizza shop selling large pizzas for $1. Customers line up around the block, but the shop cannot produce enough pizzas without losing money. Eventually, the price may rise, quantity demanded may fall, and quantity supplied may increase.
How Demand Shifts Affect Equilibrium Quantity
Equilibrium quantity changes when demand or supply shifts. A shift is different from a movement along a curve. A movement happens because price changes. A shift happens because something other than price changes.
Demand can increase because of higher income, changing tastes, population growth, strong advertising, or rising prices of substitute goods. When demand increases and supply stays the same, equilibrium price usually rises and equilibrium quantity increases.
Demand can decrease because of lower income, fading trends, fewer buyers, or better alternatives. When demand decreases and supply stays the same, equilibrium price usually falls and equilibrium quantity decreases.
Example of a Demand Increase
Suppose protein smoothies become wildly popular because a famous athlete says they are the secret to success. Demand shifts right. At the old price, customers want more smoothies than shops can supply. Shops respond by raising prices and producing more. The new equilibrium quantity is higher.
How Supply Shifts Affect Equilibrium Quantity
Supply can also shift. Supply increases when production becomes cheaper, technology improves, input prices fall, or more sellers enter the market. When supply increases and demand stays the same, equilibrium price usually falls and equilibrium quantity rises.
Supply decreases when production costs rise, weather damages crops, regulations increase costs, or sellers leave the market. When supply decreases and demand stays the same, equilibrium price usually rises and equilibrium quantity falls.
Example of a Supply Decrease
Suppose a bad growing season reduces the supply of oranges. At the old price, buyers want more oranges than farmers can provide. The supply curve shifts left. The new equilibrium price rises, and the new equilibrium quantity falls.
Common Mistakes When Finding Equilibrium Quantity
Even smart students and business owners make mistakes with equilibrium quantity. Here are the big ones to avoid.
Mistake 1: Solving for Price and Stopping There
Many problems ask for equilibrium quantity, not just equilibrium price. After solving for price, always plug it back into the demand or supply equation to find quantity.
Mistake 2: Mixing Up Qd and Qs
Demand slopes downward and supply slopes upward in most basic models. If your demand equation increases as price rises, double-check the problem. You may have copied something incorrectly, or the market may have unusual assumptions.
Mistake 3: Forgetting Units
Equilibrium quantity should include units. Are you measuring pounds, gallons, tickets, hours, meals, or subscriptions? A quantity of 500 means very little unless readers know 500 of what.
Mistake 4: Confusing a Shift With a Movement
A change in price causes movement along an existing curve. A change in income, technology, input cost, population, taste, or expectations shifts the curve. This distinction matters when predicting the new equilibrium quantity.
Quick Formula Recap
Use this simple process whenever you need to calculate equilibrium quantity:
- Start with the demand equation and supply equation.
- Set Qd equal to Qs.
- Solve for price.
- Substitute the price into either equation.
- The result is equilibrium quantity.
In short:
Qd = Qs
Solve for P
Use P to find Q
Practical Experiences Related to Finding Equilibrium Quantity
One of the best ways to understand equilibrium quantity is to stop thinking of it as a dusty classroom formula and start noticing it in everyday decisions. Equilibrium is hiding in coffee shops, farmers markets, online stores, rideshare apps, rental listings, and even neighborhood yard sales. It is not wearing sunglasses and a fake mustache, but it is definitely there.
For example, imagine helping a small bakery price muffins. At $2 each, customers may buy 200 muffins a day, but the bakery may only want to produce 120 because ingredients, labor, and packaging costs make the margin tight. That price creates excess demand. People want more muffins than the bakery is willing to sell. The result may be long lines, sold-out trays, and disappointed customers staring at crumbs like they have been personally betrayed.
Now imagine the bakery raises the price to $6. At that price, the bakery is happy to produce 220 muffins, but customers only want 80. That creates a surplus. Muffins sit unsold, and by closing time they look less like breakfast and more like accounting mistakes. Somewhere between $2 and $6 is a price where customers want to buy the same number of muffins the bakery wants to sell. The quantity sold at that price is the equilibrium quantity.
This same thinking helps with digital products. Suppose a creator sells an online course. At $19, many people enroll, but support requests, platform fees, and content updates may become overwhelming. At $299, the creator may be willing to offer more personal support, but far fewer students enroll. By testing price points and watching enrollment numbers, the creator can estimate where demand and supply feel balanced. The equilibrium quantity is not just a textbook answer; it becomes a planning tool.
Another useful experience comes from event planning. If a local workshop charges $10 per ticket, demand may exceed the room capacity. If tickets cost $150, the room may be half empty. The organizer has to consider the number of seats, the speaker fee, customer willingness to pay, and competing events. Equilibrium quantity helps estimate how many tickets are likely to sell at a sustainable price.
In real life, equilibrium is rarely frozen in place. Weather, trends, wages, shipping costs, social media buzz, and competitor pricing can all move the market. A coffee shop may discover that iced drinks have a higher equilibrium quantity in July than in January. A toy store may find that demand shifts sharply before the holidays. A landlord may notice that rental demand changes when new apartments open nearby.
The practical lesson is simple: equilibrium quantity is not just “the answer after the algebra.” It is a way to think about balance. If products sell out too quickly, price may be below equilibrium or supply may be too limited. If inventory piles up, price may be above equilibrium or demand may be weaker than expected. Good managers, students, and analysts learn to read these signals instead of blaming the universe, customers, or the office printer.
Conclusion
Equilibrium quantity is the number of units bought and sold when quantity demanded equals quantity supplied. To find it, set the demand equation equal to the supply equation, solve for price, and then substitute that price back into either equation. You can also find equilibrium quantity using a table or graph by locating the point where demand and supply match.
The concept is simple, but its usefulness is huge. It explains shortages, surpluses, price changes, production decisions, and market balance. From coffee cups to concert tickets, equilibrium quantity helps show where buyers and sellers finally agree. And in economics, agreement is a beautiful thingalmost as beautiful as getting the right answer on the first try.