
Reading a nautical chart can feel like trying to decode a pirate’s grocery list: numbers everywhere, mysterious abbreviations, colorful blobs, and symbols that appear to have been invented by someone who really enjoyed triangles. But once you learn the system, a nautical chart becomes one of the most useful safety tools on the water.
A nautical chart is not just a “map for boats.” It shows water depth, shorelines, channels, buoys, beacons, rocks, wrecks, anchorages, restricted areas, bridges, cables, lights, and other information that helps boaters plan safe routes. Whether you are cruising a bay, entering a marina, fishing near a reef, or simply trying not to turn your boat into an expensive lawn ornament, understanding chart symbols and depth information matters.
This guide explains how to read a nautical chart in 15 practical steps. The goal is not to turn you into a professional navigator overnight. The goal is to help you look at a chart and say, “Ah, yes, I understand what this means,” instead of “Why is the ocean full of tiny numbers yelling at me?”
What Is a Nautical Chart?
A nautical chart is a specialized map designed for marine navigation. Unlike a road map, it focuses on what matters to vessels: water depth, hazards, shoreline shape, navigational aids, currents, tides, channels, bottom characteristics, and safe approaches. Modern boaters often use electronic navigational charts on chartplotters, tablets, or multifunction displays, but the same core reading skills apply to paper charts and digital charts.
The most important idea is simple: a nautical chart helps you answer three questions. Where am I? Where am I going? What could ruin my day between here and there?
How to Read a Nautical Chart in 15 Steps
1. Start With the Chart Title and Coverage Area
Before reading symbols or plotting a route, confirm that you are using the correct chart for the area. The title tells you the region covered, such as a harbor entrance, coastal area, bay, river, or offshore passage. This sounds obvious, but grabbing the wrong chart is like opening a restaurant menu and trying to order a spark plug.
Look for the chart’s coverage limits and make sure your departure point, route, and destination are included. If your trip crosses from one chart to another, identify the next chart before leaving the dock.
2. Check the Chart Scale
Chart scale tells you how much real-world distance is represented on the chart. A large-scale chart covers a smaller area in greater detail, making it useful for harbors, marinas, narrow channels, and tricky approaches. A small-scale chart covers a larger area with less detail, making it better for offshore planning or broad coastal overview.
For example, a harbor chart may show individual buoys, dock outlines, rocks, and depth contours in detail. A coastal chart may show the same area as a tiny part of a much larger shoreline. When navigating close to land, use the largest-scale chart available for that area. In boating, “more detail” is usually your friend, especially when the bottom is closer than your comfort level.
3. Understand Latitude and Longitude
Nautical charts use latitude and longitude to identify position. Latitude lines run east-west and measure distance north or south of the equator. Longitude lines run north-south and measure distance east or west of the prime meridian.
The chart border usually shows latitude along the sides and longitude along the top and bottom. GPS positions are commonly displayed in degrees and minutes, such as 38° 53.200′ N, 076° 28.500′ W. To place that position on a chart, find the matching latitude on the side scale and longitude on the top or bottom scale, then locate where they intersect.
One useful rule: one minute of latitude equals one nautical mile. This is why navigators often measure distance using the latitude scale on the side of the chart, not the longitude scale.
4. Read the Depth Soundings
The many small numbers scattered across the water are called soundings. They show water depth at those locations. Depending on the chart, depths may be shown in feet, fathoms, or meters. Always check the chart notes to confirm the unit. A fathom equals six feet, which is useful to know unless you enjoy doing emergency math while drifting toward a shoal.
Depth soundings are measured relative to a chart datum, often a low-water reference in tidal areas. This means the actual water depth may be higher or lower depending on tide, weather, pressure, wind, river flow, and local conditions. If your boat draws four feet and the chart shows five feet, do not immediately celebrate. Add tide awareness, safety margin, and common sense.
5. Know Your Boat’s Draft
Your boat’s draft is how much water it needs to float without touching bottom. A small skiff may draw only a foot or two. A sailboat with a deep keel may need five, six, or more feet. Your chart-reading skills must always connect depth information to your vessel’s draft.
For safe navigation, compare charted depth, tide height, expected squat, wave action, and your desired under-keel clearance. If the chart says eight feet, your boat draws six feet, and you are entering at falling tide, you are not “basically fine.” You are negotiating with mud.
6. Follow Depth Contour Lines
Depth contour lines connect areas of similar depth. They show the shape of the underwater landscape, much like elevation lines on a hiking map. Contours close together indicate a steep change in depth. Contours spread far apart suggest a gentler bottom slope.
Contour lines help you spot channels, shoals, drop-offs, flats, bars, and underwater ridges. Fishermen use contours to find structure. Navigators use them to avoid running aground. If your planned route crosses quickly from deep water into shallow contour zones, slow down and investigate. The chart is waving politely before the propeller starts complaining loudly.
7. Learn the Main Chart Colors
Nautical chart colors are not decoration. They communicate important information quickly. White or very light areas often represent deeper water. Blue usually marks shallower water, with darker blue commonly indicating less depth. Green areas may show intertidal zones that cover and uncover with the tide. Tan or yellow areas usually represent land.
Colors can vary between chart products and display settings, especially on electronic charts, so always use the chart legend and symbol reference. Do not rely on color alone. A bright screen in sunlight, night mode, or a poorly adjusted display can make colors less obvious.
8. Identify Buoys, Beacons, and Daymarks
Aids to navigation help boaters follow safe water, identify channels, avoid hazards, and locate important features. Buoys float and may move slightly from their charted positions because of wind, current, storms, ice, or collisions. Beacons and daymarks are fixed structures attached to land or the bottom, making them more reliable for position reference.
In U.S. waters, lateral marks use red and green to show channel sides. The well-known memory phrase “red right returning” means that when returning from seaward or heading upstream, red markers are kept on your starboard, or right, side. Green markers are kept to port. This phrase is helpful, but you still need context. Channels, rivers, and local conventions can confuse beginners, so verify your direction of travel on the chart.
9. Decode Lights and Light Characteristics
Many charts include lights with abbreviations that describe color, flash pattern, height, and range. For example, a chart may show a flashing green light, its flash interval, its height above water, and its visible range in nautical miles. This information is extremely useful at night or in reduced visibility.
Common light abbreviations include “Fl” for flashing, “Iso” for isophase, “Oc” for occulting, and color letters such as R for red, G for green, W for white, and Y for yellow. Light patterns help you confirm that the light you see is the same one shown on the chart. At night, guessing is not navigation; it is marine-themed optimism.
10. Watch for Rocks, Wrecks, Shoals, and Obstructions
Nautical charts mark dangers such as rocks, wrecks, reefs, submerged piles, fish havens, breakwaters, and obstructions. Some are always underwater. Some uncover at low tide. Some are dangerous only to deeper-draft vessels. Symbols and abbreviations tell you what kind of hazard it is and whether depth over it is known.
Pay special attention to hazards near channels, harbor entrances, and shortcuts. Many groundings happen because someone thinks, “We can just cut across here.” Sometimes you can. Sometimes the chart says no in six different symbols and the boat says no with a crunch.
11. Use the Compass Rose
The compass rose printed on a chart helps you measure direction. It usually includes true direction and magnetic direction. True north points to the geographic North Pole. Magnetic north points toward the magnetic pole, which is not in the same place and changes over time.
When plotting a course, you may draw a true course on the chart, then convert it to magnetic or compass course using variation and deviation. Variation is the angle between true north and magnetic north in that area. Deviation is error caused by magnetic influences on your boat. Electronic systems do much of this work, but understanding the difference helps you catch mistakes.
12. Measure Distance Correctly
Distance on nautical charts is measured in nautical miles. Use dividers or a plotting tool to measure the distance between two points, then transfer that measurement to the latitude scale on the side of the chart. One minute of latitude equals one nautical mile.
Avoid measuring distance on the longitude scale because the spacing changes with latitude. If you are using an electronic chartplotter, it may calculate distance automatically, but it is still smart to understand the manual method. Batteries, screens, and software have a talent for failing at dramatic moments.
13. Plot a Safe Course
To plot a route, mark your starting point, destination, and logical waypoints. Then draw course legs that keep your vessel in safe water, avoid hazards, respect restricted areas, and allow room for traffic, current, wind, and turning radius.
Do not draw a route that barely clears danger. Give yourself a buffer. Boats are not pencils; they drift, slide, yaw, and occasionally do things that make captains invent new vocabulary. A good course accounts for reality, not just geometry.
As you plan, check every leg for depth, overhead clearance, bridge openings, cables, rocks, wrecks, traffic separation schemes, anchorages, and speed zones. If a route looks too perfect, zoom in or switch to a larger-scale chart. The tiny detail you miss is often the detail with teeth.
14. Compare the Chart With What You See
Navigation is not a one-time activity. Once underway, compare your charted position with GPS, visual landmarks, buoys, compass bearings, radar, depth sounder readings, and local conditions. If your depth sounder reads much less than expected, slow down and investigate. If a buoy is missing or appears off station, do not blindly trust the symbol on the screen.
The U.S. Coast Guard warns boaters not to rely solely on any single aid to navigation, especially buoys, because they can shift, sink, capsize, or be damaged. The safest habit is cross-checking. GPS is helpful. Charts are helpful. Your eyes are helpful. Together, they form a team. Alone, each one can be wrong.
15. Keep Charts Updated
Charts change. Buoys move. Lights are modified. Shoals are discovered. Wrecks appear. Dredging changes channels. Storms rearrange the bottom like a toddler rearranging a toy box. That is why updated chart information matters.
NOAA electronic navigational charts are updated regularly, and mariners can check official chart updates and Local Notices to Mariners for changes. If you use printed custom charts, make sure they are current before relying on them. If you use a chartplotter or navigation app, update your chart data frequently. “It was accurate three years ago” is not a safety plan.
Common Nautical Chart Symbols Beginners Should Know
Soundings
Soundings are depth numbers. They may be in feet, meters, or fathoms. Always confirm the unit before making decisions.
Depth Contours
Depth contours show areas of equal depth and help reveal underwater shape, including channels, shoals, and drop-offs.
Buoys
Buoys are floating aids to navigation. They may mark channel edges, hazards, safe water, mooring areas, or special zones.
Beacons and Daymarks
Beacons and daymarks are fixed aids. They are often more dependable for visual position checks than floating buoys.
Wrecks and Obstructions
Wreck symbols may show whether a wreck is visible, submerged, dangerous, or considered safe to pass over depending on depth.
Restricted Areas
Restricted areas, security zones, military zones, and regulated areas may limit entry, speed, anchoring, fishing, or other activities.
Paper Charts vs. Electronic Charts
Many boaters now navigate primarily with electronic charts. Electronic navigational charts can show layers, real-time vessel position, alarms, route planning tools, tides, marina information, and customizable detail. They are convenient and powerful.
Paper-style chart reading skills still matter. A chartplotter can zoom, rotate, declutter, and hide information depending on settings. If you do not understand what the symbols mean, the screen can create false confidence. It may look clean because important layers are turned off or because you are zoomed too far out to see hazards.
The best approach is to understand the chart itself, then use electronics as an efficient tool. Technology should make you smarter, not simply more relaxed while approaching a sandbar.
Example: Reading a Simple Harbor Approach
Imagine you are entering a harbor in a boat that draws four feet. The chart shows a marked channel with depths of 12 to 18 feet, but outside the channel the water quickly shoals to three feet. Red and green buoys define the route. A flashing green light marks one side of the entrance. A wreck symbol appears outside the channel near the harbor mouth.
A safe reading would go like this: stay in the marked channel, confirm the correct side of the buoys based on direction of return, check the light pattern if entering at night, avoid the wreck area, monitor the depth sounder, and allow room for wind or current to push the boat sideways. You would not cut across the shallow area just because it saves three minutes. Three minutes saved can become three hours waiting for the tide, plus one very awkward phone call.
Beginner Mistakes to Avoid
One common mistake is ignoring chart scale. A route that appears safe on a small-scale chart may show hazards when viewed on a large-scale harbor chart. Another mistake is assuming charted depth equals actual depth at all times. Tides and water levels matter. A third mistake is blindly following GPS without looking ahead. GPS tells you where you are; it does not automatically guarantee that where you are going is deep, legal, or smart.
Beginners also forget to check overhead clearance. Bridges, power lines, and cables may be charted with vertical clearance information. Sailboats, antennas, outriggers, and towers need room above, not just water below. Boats are three-dimensional objects, even when captains plan like pancakes.
Practical Experiences: What Reading a Nautical Chart Teaches You Over Time
The first time many boaters read a nautical chart, they focus on the obvious things: the coastline, the route, and the big scary shallow areas. That is a good start, but experience teaches you that charts reward patience. The longer you study one, the more it tells you. A beginner sees water. A careful navigator sees a story of depth, current, traffic, bottom shape, exposure, escape routes, and “maybe don’t go there today.”
One practical lesson is that the chart and the real world must be read together. On a calm morning, a narrow channel may seem simple. By afternoon, wind against tide can stack up chop, push a boat sideways, and make the same channel feel much tighter. The chart gives the structure of the route, but conditions decide how forgiving that route will be. Experienced boaters learn to ask, “What will this look like when the tide turns?” instead of only “Can I fit through right now?”
Another experience is learning to respect shallow water even when it looks harmless. Clear, sunny water can trick your eyes. Muddy water can hide everything. A sandy flat may look soft and friendly until the boat stops with the confidence of a parking brake. Charts help prevent that by showing depth trends before you reach them. If you notice soundings changing from 15 feet to 10, then 7, then 4, the bottom is coming up. That is not random decoration. That is the seafloor politely entering the conversation.
Good chart readers also develop the habit of planning alternatives. Before leaving, they look for bailout points, deeper water nearby, anchorages, marinas, turning basins, and hazards downwind. This matters because boating plans change. Fog appears. Engines overheat. Crew members get seasick. Weather arrives early. A chart is not only for the perfect trip; it is for the imperfect trip, which is the one boats seem to prefer.
Electronic charts add another layer of experience. They are wonderfully useful, but zoom level can fool you. Zoomed out, hazards may disappear or become too crowded to interpret. Zoomed in, you may lose the broader picture. Many experienced boaters constantly zoom in and out: close view for hazards, wide view for context. They also check settings to make sure important layers, depth units, and safety contours are displayed correctly.
A final lesson is humility. Nautical charts are powerful, but they are not magic shields. A chart may be based on surveys of different ages and quality. Buoys may be off station. Private aids may change. Local knowledge may matter. Your job is to combine the chart, updated notices, onboard instruments, weather, tide data, and what your eyes see. That combination is seamanship.
When you learn to read a nautical chart well, boating becomes less stressful and more intentional. You are no longer just following a blue line on a screen. You understand why the route bends, why the marker matters, why the contour line deserves respect, and why the shortcut is sometimes named “Bad Idea Channel” in your private mental chartbook.
Conclusion
Learning how to read a nautical chart is one of the most valuable skills a boater can develop. It helps you understand depth soundings, identify hazards, follow channels, interpret buoys and lights, measure distance, plot courses, and make safer decisions on the water. Even if you use a modern chartplotter, the fundamentals remain the same.
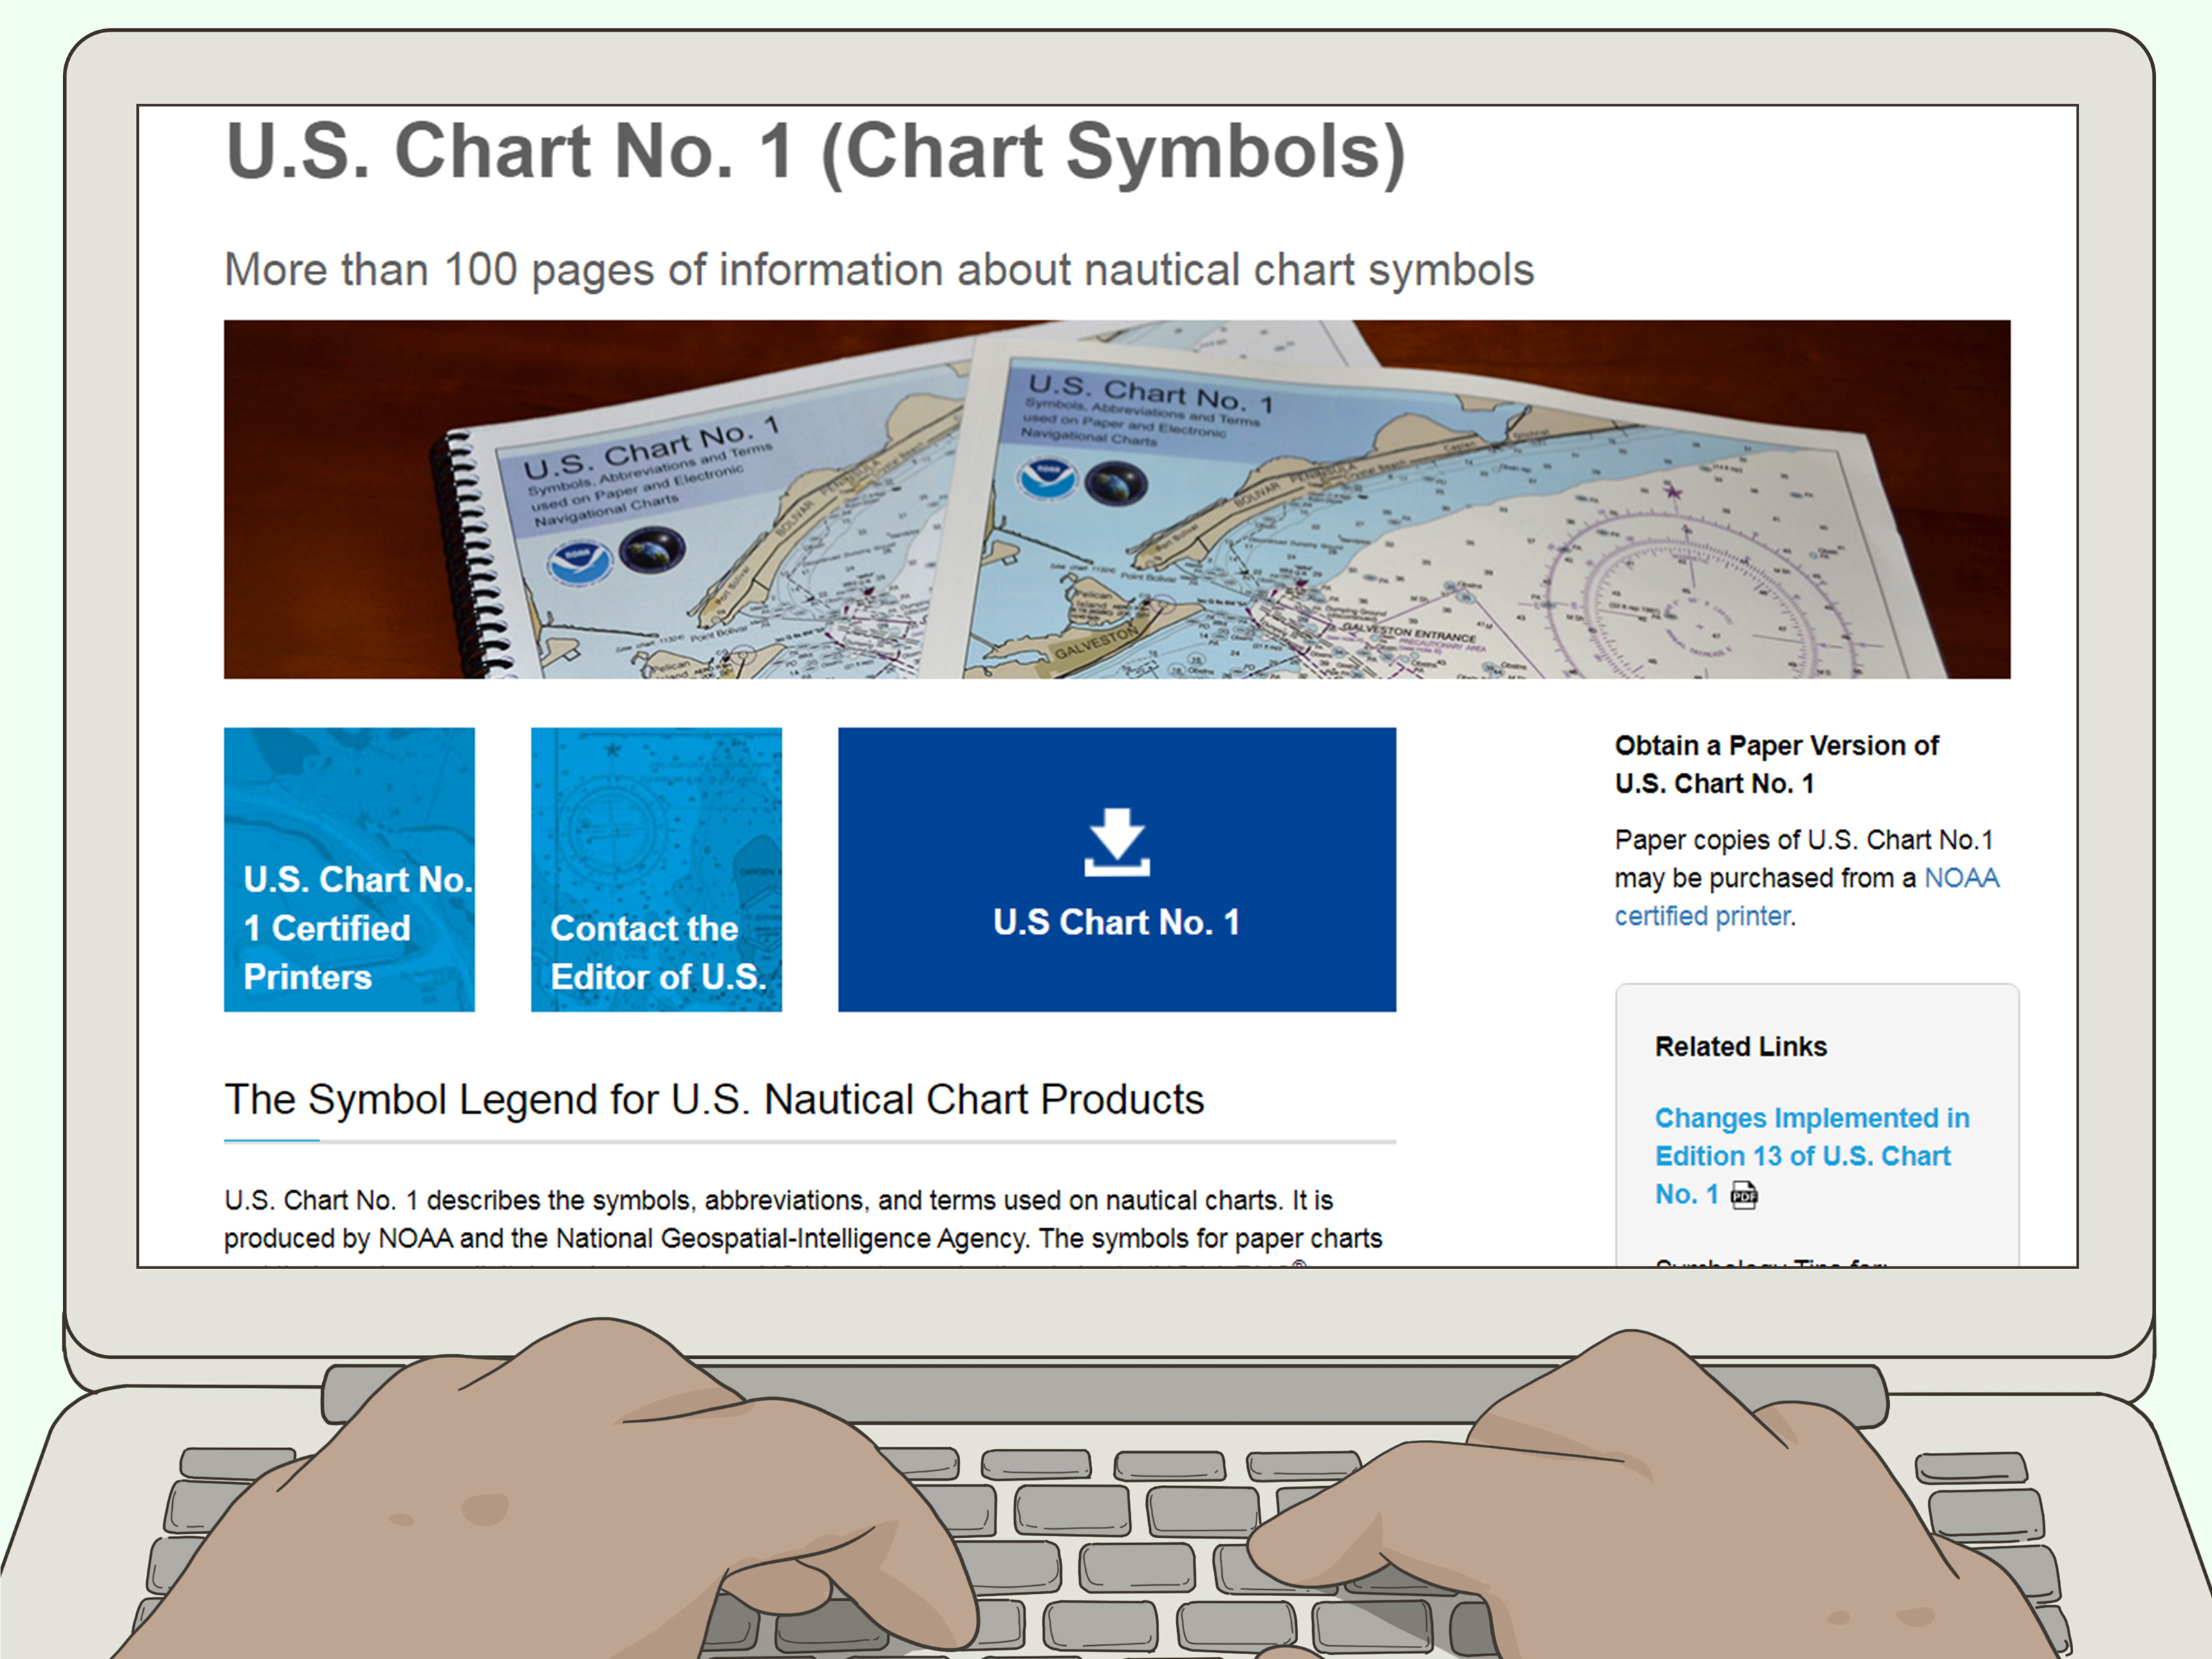
Start with the chart title, scale, units, and datum. Study the soundings and contour lines. Learn the symbols in U.S. Chart No. 1. Respect aids to navigation but do not rely on just one source of information. Keep your charts updated, compare them with real-world observations, and always leave a margin for error.
The water does not grade on a curve. But with a good chart, a careful eye, and a little practice, you can navigate with more confidence, fewer surprises, and far less drama from your propeller.
SEO Tags
Note: This article is for educational boating and navigation awareness. Mariners should use current official chart products, updated notices, local regulations, weather forecasts, tide information, and safe boating practices before getting underway.