
That suspicious vine swallowing a roadside fence may be more than an overachieving plant. The spotted insect on your patio furniture may not be a harmless visitor. Even the innocent-looking shell stuck to a boat trailer can be a tiny ecological wrecking ball. Invasive species often hide in plain sight, which is one reason an interactive invasive species map can be so useful.
The Early Detection and Distribution Mapping System, better known as EDDMapS, lets people explore reported invasive plants, insects, wildlife, diseases, mollusks, fish, and other organisms across the United States and Canada. Instead of wondering what might be creeping, rooting, swimming, or aggressively photosynthesizing nearby, users can search actual records by place, date, and species.
What Counts as an Invasive Species?
Not every organism from somewhere else is invasive. Federal guidance generally describes an invasive species as a nonnative organism whose introduction causes, or is likely to cause, environmental damage, economic losses, or harm to human health. That distinction matters. A garden tulip may be nonnative without staging a botanical coup. An invasive plant, by contrast, can escape cultivation, spread rapidly, crowd out native vegetation, and alter habitat.
Invasive species include more than weeds and headline-grabbing insects. They can be mammals, reptiles, fish, mussels, fungi, pathogens, aquatic plants, grasses, or forest pests. Their effects may include damaged crops, clogged water infrastructure, reduced biodiversity, degraded recreation areas, weakened forests, and expensive control programs. In other words, the problem is not that an organism forgot its passport. The problem is what it does after arriving.
Meet EDDMapS, the Interactive Invasive Species Map
EDDMapS is a web-based platform created in 2005 by the University of Georgia’s Center for Invasive Species and Ecosystem Health. It was designed to make invasive species mapping practical for agencies, researchers, land managers, conservation groups, and ordinary people who do not casually discuss geographic information systems over breakfast.
By July 2025, the database contained about 9.1 million records drawn from partner organizations and public observations. Reports submitted through the platform are reviewed before becoming part of the verified dataset. That quality-control step is important because a blurry photograph of a native beetle should not launch a countywide panic.
The map can display information at broad and detailed scales, including state, county, and individual observation levels. Users can explore categories such as plants, insects, wildlife, reptiles, fish, mollusks, and fungi or diseases. Species pages may also include identification images, taxonomy, descriptions, distribution information, and related resources.
What the Map Can Tell You
The map answers questions such as: Which invasive species have been reported in my county? Has a particular pest appeared in my state? Are records recent or historical? Where is the apparent leading edge of an infestation? These details can help gardeners, hikers, anglers, boaters, farmers, teachers, and property owners learn what deserves a second look.
What the Map Cannot Tell You
A mapped point confirms a record, not the total population. A county with many dots may have a serious infestation, unusually active surveyors, or both. A blank area does not prove that an invasive species is absent; it may simply be underreported. Map data should therefore be treated as evidence of documented presence rather than a perfect census of every leaf, larva, hog, and mollusk.
How to Find Invasive Species Near You
1. Start With Your State or County
Open the EDDMapS distribution or custom-query map and narrow the view to your state. For a neighborhood-level search, select a county. This keeps the national sea of records from becoming a game of ecological confetti.
2. Adjust the Date Range
Recent records are useful when you want to know what observers are seeing now. A longer date range reveals how a species has spread over time. Comparing older reports with newer ones can show whether an organism appears established, expanding, or newly detected in an area.
3. Filter by Species or Category
Search a known species, such as spotted lanternfly, tree-of-heaven, zebra mussel, or feral swine. Alternatively, browse a category if you are unsure what you saw. This is especially useful when your field identification is “weird bug with dramatic wings” or “plant that has conquered the back fence.”
4. Open Individual Records Carefully
Observation details may include location, date, photographs, record status, and other field information. Use these clues to compare habitat, season, size, markings, leaves, fruit, bark, tracks, or other features. Avoid relying on color alone; lighting and life stages can make identification surprisingly tricky.
5. Cross-Check With Specialized Resources
For aquatic organisms, the U.S. Geological Survey’s Nonindigenous Aquatic Species database provides state searches, species profiles, distribution maps, drainage-basin queries, and occurrence information. State agriculture departments, cooperative extension services, tribal natural-resource offices, and local invasive species councils can provide region-specific guidance.
Invasive Species You May See in Different U.S. Regions
Northeast and Mid-Atlantic
Residents may encounter spotted lanternflies, tree-of-heaven, Japanese knotweed, garlic mustard, or forest pests such as emerald ash borer. The spotted lanternfly became especially visible after the first known U.S. infestation was detected in Pennsylvania in 2014. It feeds on numerous plants and is strongly associated with tree-of-heaven, another invasive species. That pairing is nature’s least charming buddy comedy.
Great Lakes and Midwest
Zebra and quagga mussels are major aquatic concerns because they attach to hard surfaces, alter food webs, foul boats, and clog intake systems. Eurasian watermilfoil can form dense mats that interfere with boating and swimming. On land, garlic mustard, buckthorn, emerald ash borer, and invasive jumping worms may appear in regional records. The USGS aquatic database is especially helpful here because water connects locations faster than a county boundary suggests.
Southeast and Gulf Coast
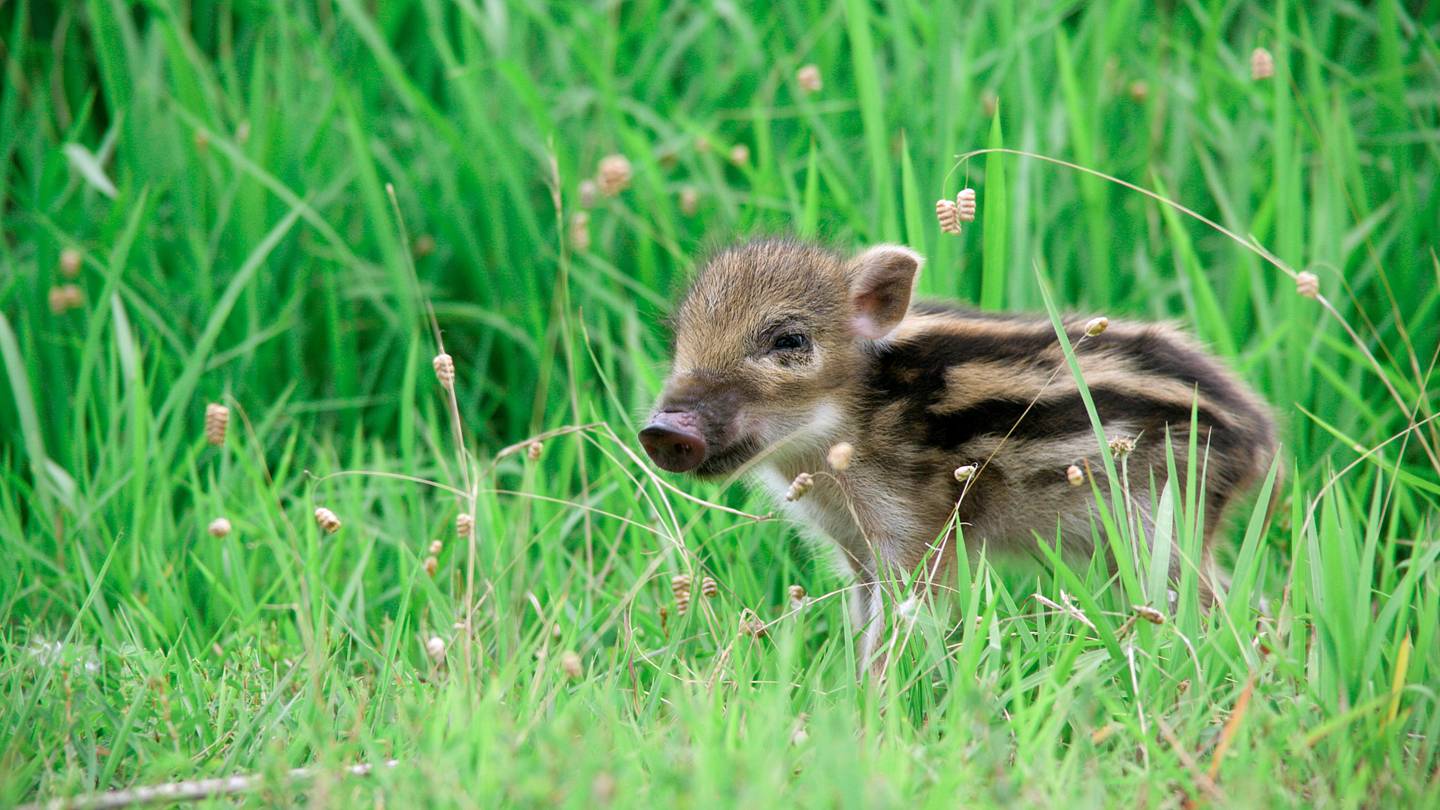
The Southeast hosts a long and colorful guest list: kudzu, cogongrass, hydrilla, feral swine, lionfish, andespecially in South FloridaBurmese pythons and invasive tegus. Feral swine disturb soil, damage crops, prey on wildlife, and can help spread invasive plant seeds. Their distribution has been reduced in some areas through coordinated management, but they remain a serious problem across much of the country.
West and Southwest
Western users may find records for cheatgrass, yellow starthistle, tamarisk, invasive annual grasses, and aquatic mussels. Cheatgrass can alter fire patterns by creating highly flammable fine fuel. Quagga mussels are a major concern in parts of the Southwest, where agencies inspect watercraft to reduce movement between reservoirs.
Hawaii and Other U.S. Islands
Island ecosystems are particularly vulnerable because many native species evolved in isolation. Invasive coqui frogs, little fire ants, mosquitoes, plants, predators, and pathogens can create outsized damage. Maps are useful, but local reporting instructions are essential because island agencies may prioritize rapid response to specific high-risk organisms.
Why Early Detection Matters
An invasive species is usually easier and cheaper to address when only a few individuals occupy a small area. Once it spreads through a watershed, forest, agricultural region, or urban corridor, eradication may become unrealistic. Managers may then have to settle for containment, long-term suppression, or protection of especially valuable sites.
Interactive mapping turns scattered observations into a shared warning system. A report from a homeowner can help an expert confirm a new county record. A cluster of verified observations can guide surveys. A newly mapped point beyond the known range can trigger investigation. Citizen science is not a replacement for professional monitoring, but it gives professionals many more eyesand occasionally a surprisingly good smartphone photo.
How to Report a Possible Sighting Responsibly
First, take clear photographs from several angles. Include close-ups and wider images showing the surrounding habitat. For plants, photograph leaves, stems, bark, flowers, fruit, and the full growth form when possible. For insects or animals, document distinctive markings without handling anything dangerous.
Record the date and precise location. Note the number of organisms, the area covered, nearby host plants, and relevant habitat details. Submit the observation through EDDMapS or the reporting channel recommended by your state. Do not report intentionally planted landscaping, zoo animals, livestock, or pets as wild occurrences merely because they are nonnative.
Most importantly, do not transport the organism for identification unless an agency specifically instructs you to do so. Moving a specimen can spread seeds, eggs, larvae, pathogens, or fragments capable of starting a new population. The heroic plan is to send good evidence, not to arrive at an extension office holding a mystery snake in a laundry basket.
Simple Ways to Stop the Spread
- Clean, drain, and dry watercraft and gear. Remove plants, mud, and standing water before moving to another water body.
- Brush boots and clean equipment. Seeds and soil can travel in shoe treads, tire grooves, pet fur, tools, and camping gear.
- Do not move firewood long distances. Buy it where you burn it to avoid transporting hidden insects and diseases.
- Choose native or noninvasive plants. Ask local nurseries or extension experts for suitable alternatives.
- Never release aquarium organisms or unwanted pets. Contact a retailer, rescue group, veterinarian, or wildlife agency for responsible options.
- Report unusual sightings early. A verified record at the edge of a species’ range may be far more valuable than the thousandth report from its established center.
National Park Service guidance emphasizes cleaning footwear, clothing, camping equipment, boats, trailers, motors, and other gear that can carry seeds or aquatic organisms between locations. These habits are not glamorous, but neither is paying to remove mussels from a clogged intake pipe.
A Realistic Experience: Turning the Map Into a Local Nature Check
Imagine opening the invasive species map before a Saturday hike. You select your state, narrow the search to your county, and expect perhaps three or four obvious troublemakers. Instead, the screen fills with records. Some names are familiar. Others sound like rejected fantasy villains: mile-a-minute weed, hammerhead worm, giant hogweed, or something equally determined to ruin a pleasant picnic.
The first useful surprise is that the map changes how you look at ordinary places. The weedy edge of a parking lot becomes a potential introduction corridor. A boat ramp looks less like a slab of concrete and more like an international airport for microscopic hitchhikers. A patch of vines that once registered as “green stuff” suddenly deserves a closer, hands-off inspection.
On the trail, the goal is not to accuse every unfamiliar organism of ecological misconduct. It is to observe more carefully. You notice whether leaves grow opposite or alternately, whether a stem is hollow, whether an insect has spots on the outer wings and bright color beneath, or whether the forest floor looks strangely bare. You take photos, include a ruler or common object for scale, and save the location without pulling, crushing, or relocating the specimen.
Back home, comparing the photos with verified images becomes the most educational part. Sometimes the exciting “discovery” is a native look-alike, which is excellent news and a useful lesson. Sometimes the identification remains uncertain, and the correct move is to submit the evidence for expert review. The map encourages curiosity while its verification process discourages confident guessinga healthy combination in ecology and in group chats.
A second search may reveal that a species has numerous historical records nearby but few recent ones. That does not automatically mean it disappeared. Reporting effort may have changed, control work may have reduced it, or recent observations may not yet be available. This is where the user learns the map’s most important lesson: dots are data, not the whole story.
The experience becomes even more practical for boaters and gardeners. A paddler can check nearby waters for zebra mussels, hydrilla, or other aquatic invaders and become stricter about cleaning gear. A homeowner can look up invasive ornamentals, compare alternatives, and avoid planting next year’s neighborhood headache. A teacher can ask students to examine county records and discuss why highways, rivers, nurseries, shipping, recreation, and climate influence spread.
After a few searches, the map stops feeling like a catalog of doom. It becomes a tool for informed action. You may brush your boots, inspect firewood, clean a trailer, replace an invasive shrub, or report a suspicious insect. None of those actions is cinematic. There is no dramatic soundtrack. Yet prevention is often built from small, repeatable choices made by people who noticed what was around them and cared enough not to carry it somewhere else.
Conclusion: Your Neighborhood Is Part of the Map
Invasive species do not respect property lines, county borders, or the emotional attachment you have to a favorite fishing spot. EDDMapS makes their documented distribution easier to explore and gives the public a structured way to contribute observations. Used alongside USGS aquatic records and local agency guidance, it can help you understand regional risks without turning every walk outdoors into a botanical crime investigation.
Search your county, study verified images, learn the common look-alikes, and report carefully. Then focus on prevention: clean gear, drain boats, avoid moving firewood, plant responsibly, and never release unwanted organisms. The most useful dot on an invasive species map may be the one that helps a community act before thousands more appear.